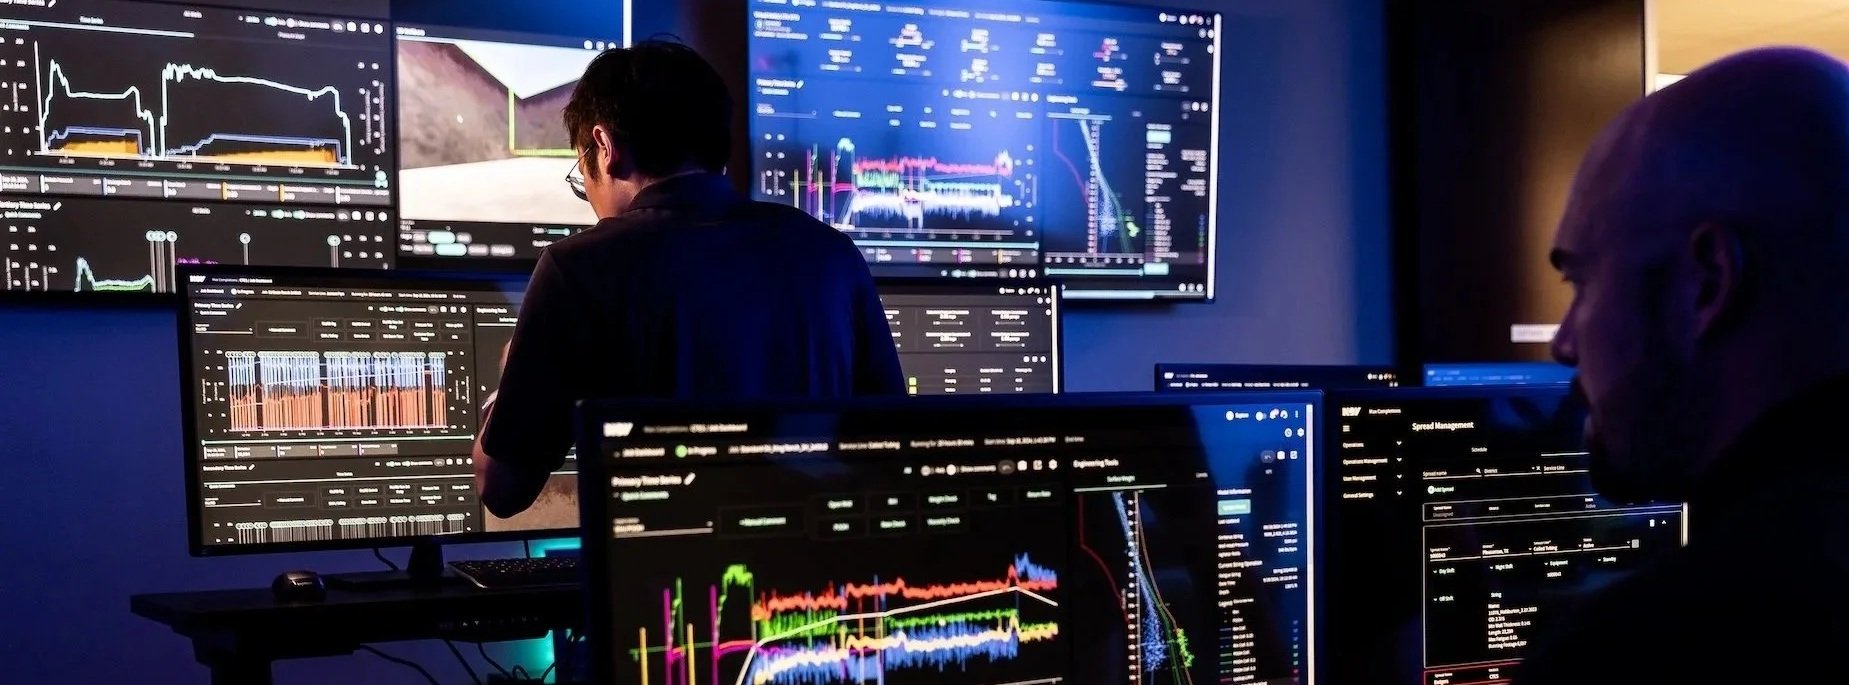

MAX COMPLETIONS
Redesigning an operational dashboard for complex teams.
MAX Completions is an enterprise SaaS application within NOV’s MAX platform, used by oil and gas teams to monitor and analyze operations during the well-completion process.
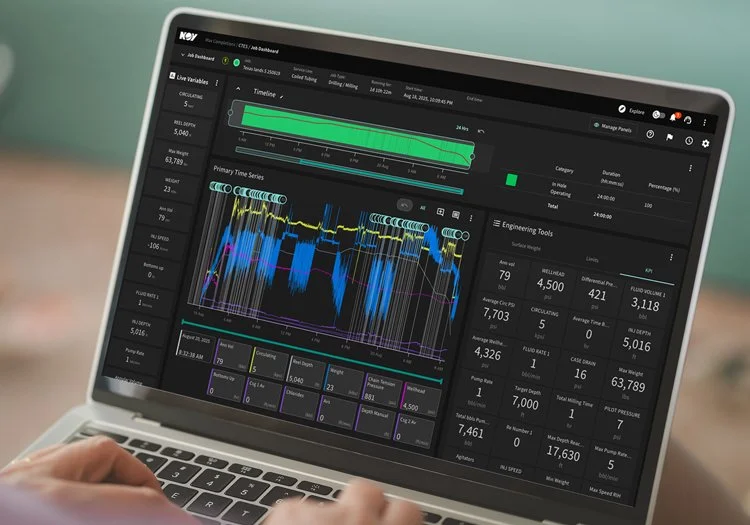
I redesigned the Job Dashboard to make dense operational information easier to navigate, interpret, and act on while preserving the technical depth different users rely on.
Product Designer | UX Research | Information Architecture | Interaction Design
Project Overview
One product. Very different needs.
MAX Completions supports a variety of users with different priorities, responsibilities, and needs. Some need to understand overall job performance, while others need to monitor what is happening in real time and respond quickly.
The existing dashboard contained a large amount of useful information, but the experience did not always make priority clear. Dense content, competing visual elements, and fragmented workflows could make important information harder to find, interpret, or act on.
The primary challenges included unclear hierarchy, difficult-to-scan content, unnecessary navigation, and limited flexibility to organize the workspace around different priorities.
The opportunity went beyond simply letting users choose which panels appeared. The dashboard also needed to account for priority, timing, level of detail, alerts, supporting context, and the actions available from the information being presented.
The goal wasn't to show less information. It was to make the right information easier to understand and act on.
A Shared Workspace for Very Different Decisions.
Two broad needs emerged across the MAX experience:
Understanding job performance
What happened? What is happening at a high level? Is the job performing as expected, and what requires further investigation or follow-up?
Monitoring and responding to a job
What is happening right now? Has something meaningful changed? How significant is it, and what action, if any, should I take based on the data available?
That distinction shaped how I approached hierarchy and information density.
A field operator may need to recognize a change and respond quickly. A supervisor may need to understand what occurred during a shift. An engineer may need to investigate the underlying cause, while a customer may primarily need visibility into whether the job is progressing as expected.
These users aren't simply different levels of the same audience. They are making different decisions with different levels of urgency and depth.
The interface therefore needed to surface the right level of information for each task while maintaining consistent terminology, navigation, and interaction patterns across the product.
A Clearer Operational Dashboard
Turning dense operational data into a more focused, flexible workspace.
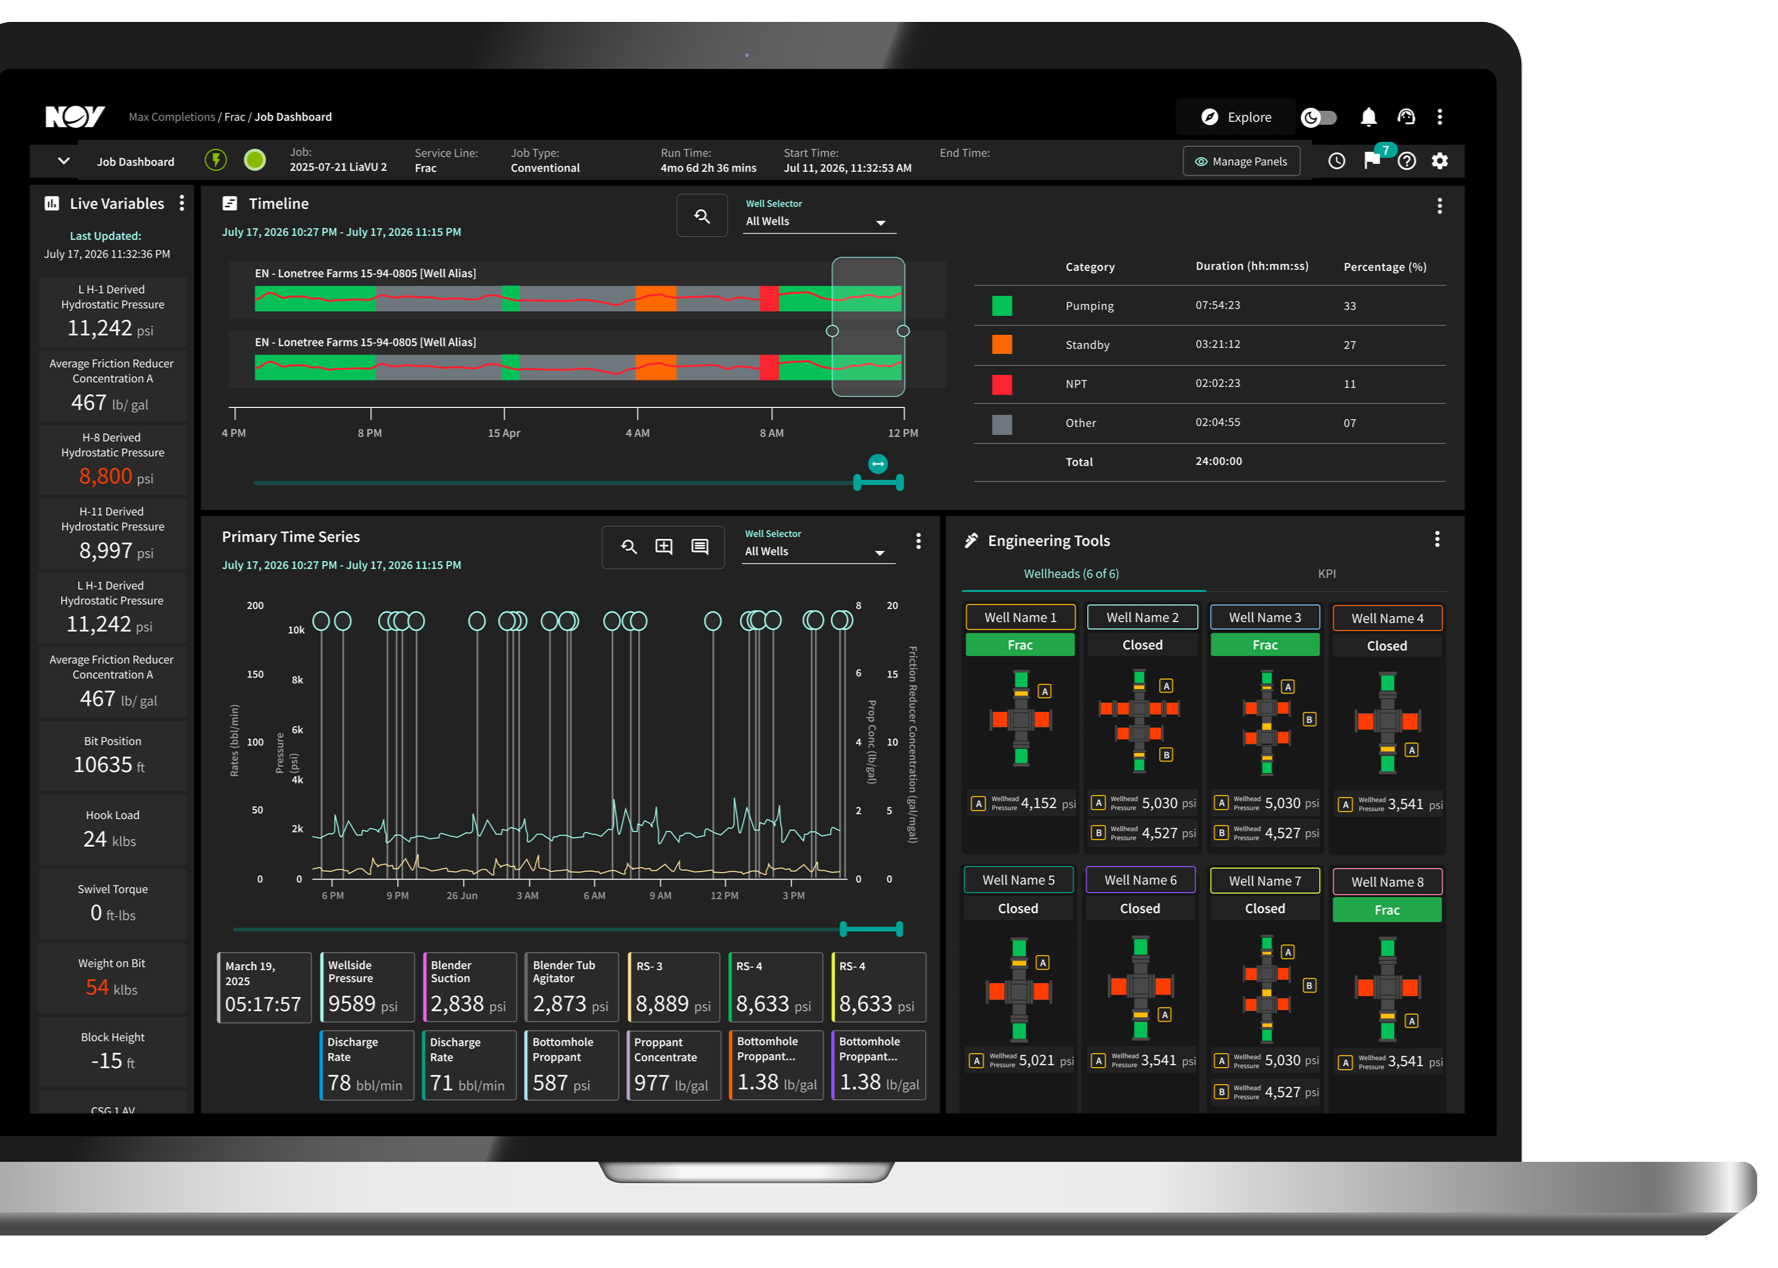
-
Larger text, less visual clutter, and more focused dashboard cards make dense operational information easier to scan.
-
Manage Panels lets users show, hide, or open dashboard areas based on their workflow and priorities.
-
The updated well configuration diagram represents the actual well setup and includes real-time status indicators, helping users make informed decisions without piecing information together across the dashboard.
-
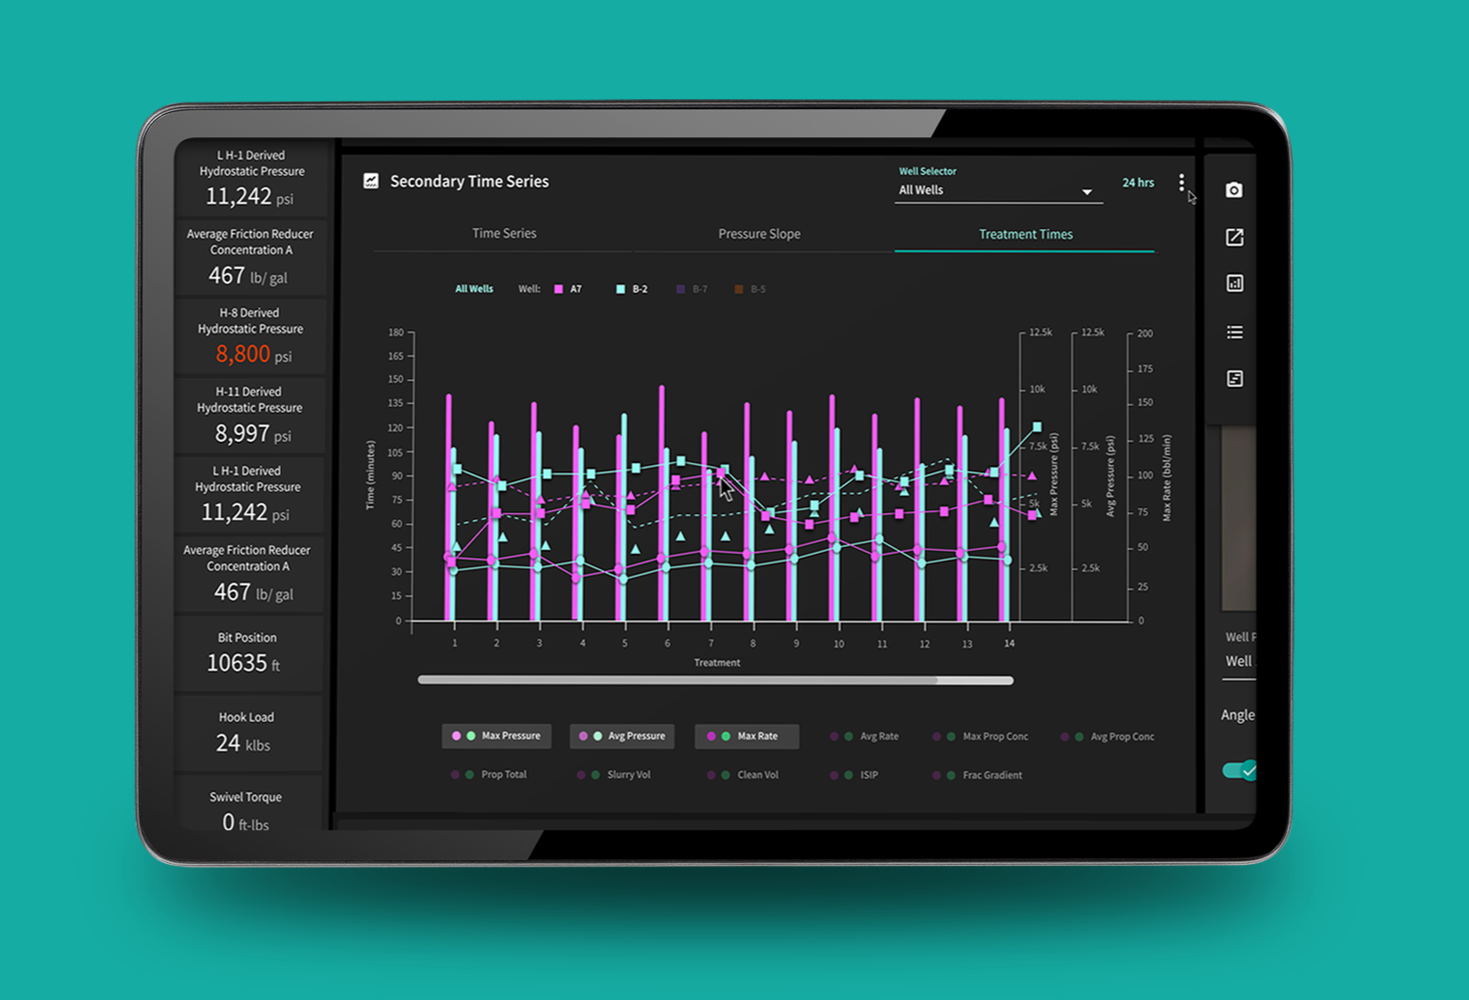
Users can switch between horizontal and vertical layouts and use text color to identify threshold states.
-
Dashboard, chart, and panel actions are organized into contextual menus, reducing persistent interface clutter.
-
Users can move from a chart event directly to the related entry in the Job Comments log.
View previous dashboard →
What Informed the Redesign
Combining user feedback, support insights, and behavioral data.
The redesign was informed by customer feedback, stakeholder and support input, user stories, questionnaires, and behavioral data from Pendo and Datadog/RUM.
I used those sources differently. Qualitative feedback helped me understand recurring needs, pain points, and operational context, while behavioral data helped identify usage patterns and areas that warranted deeper investigation.
Taken together, those inputs helped me move beyond individual feature requests and make decisions about the structure of the broader dashboard experience.
Iterating Toward the Final Experience
Refining the existing product through feedback, constraints, and ongoing review.
The dashboard evolved through ongoing reviews with product teams, stakeholders, subject-matter experts, and customers. Feedback surfaced new requirements, workflow details, and usability issues as the work progressed.
Rather than following a linear wireframe-to-final process, I refined the existing experience directly—adjusting hierarchy, layout, panel behavior, navigation, and interaction patterns as new feedback and technical constraints emerged.
This let me evaluate changes in the context of the real product and continuously balance usability improvements with the functionality experienced users already
relied on.
Outcomes
Post-launch signals showed stronger engagement and less interaction friction.
Across the 90 days after launch, unique dashboard visitors increased 17%, from 741 to 869, while average time per visitor increased from 2h 32m to 2h 58m. Other friction indicators also declined, including U-turns (−48%) and dead clicks (approximately −18%).
Customer feedback was particularly positive around the redesigned commenting experience and the new Manage Panels customization feature, which gave users more control over which dashboard areas were visible. Because other product changes occurred during the same period, I treat these as post-launch signals rather than attributing every change solely to the redesign.

Recurring feedback themes:
Users consistently highlighted easier commenting and greater control through Manage Panels, helping to keep information and communication closer to their workflow.
What I Took Away
A broader lesson in designing for complexity without oversimplifying it.
In the job dashboard, users needed to interpret dense technical information, recognize meaningful changes, and move from awareness to investigation quickly.
The broader lesson was that good UX is not always about making a product simpler. It is about making complexity easier to navigate, helping people focus on what matters, and reducing friction between information and action.
Designing complex products
isn’t about removing complexity.
It’s about making
the path through it clearer.